


Oil & Eve Business Requirements Document (BRD)
Reporting Period: January – June 2025
Prepared: June 30, 2025
Executive Summary
Oil & Eve, a premium hemp company based in Georgia, proudly announces its official launch in Q1 2025, following a ground-up, founder-led journey of self-funded development, licensing, and strategic rollout. This quarter laid the groundwork for the company’s long-term vision — to bring premium cannabis products to the Southeast in a legal, transparent, and customer-first way.
In the first half of 2025, Oil & Eve transitioned from a pre-launch concept into a fast-growing cannabis delivery brand rooted in quality, convenience, and Southern culture. Official sales began in February, followed by a March brand rollout. From that point on, we saw continuous month-over-month momentum.
By June, Oil & Eve grew total sales from $X,100 in February to $X4,495 by June — a 590% increase. Each month brought higher order counts, broader SKU performance, and better category conversion. Our core differentiator — Peace for moments that matter — resonated with repeat buyers, who now make up 26% of total order volume. We shipped over XXX products across XXX orders in the first two quarters.
Q2 represented a strong maturity curve for our internal operations, product offering, and catalog structure. We integrated Google Analytics and Search Console, completed metadata refinements, tested geo pages and bundles, and more than tripled monthly sales from April to June. Solventless extracts, 510 cartridges, and low-dose edibles dominated the top-line revenue.
Financial Performance Summary
Quarterly Breakdown
| Quarter | Total Sales ($) | Orders |
|---|---|---|
| Q1 | $X,776 | XX |
| Q2 | $X6,842 | XX |
| H1 | $X6,618 | XXX |
Q1 Overview
Q1 established the foundation. We launched operations in February with X sales totaling $X,100. Our first real month was March, with $X,676 in revenue and XX successful orders. Our catalog was small, payment flows were evolving, and checkout issues were still being addressed.
Despite this, March saw strong per-order revenue and robust interest in solventless rosin and cartridges. Early customers expressed clear preferences that would shape Q2 merchandising strategy. Manual fulfillment taught us logistics, and post-order SMS support became a key brand differentiator.
Q2 Overview
In Q2, Oil & Eve scaled. April hit $X3,239 in revenue and introduced our first 4/20 product bundles. May dipped slightly to $X,108 as we cleared older inventory and prepared for a June restock. June surged to $X4,495 in total sales — our biggest month yet — with XX orders and XXX products shipped.
Q2 also marked the beginning of in-house products, which now account for 27%+ of all units sold. Solventless Rosin and Concentrates together contributed over $X0,000 in sales monthly. We streamlined fulfillment, improved labeling, and added custom strain drop banners to the home page.
Repeat customers made up 26% of Q2 orders. Cart abandonment dropped from 35% to 18% across the quarter after we upgraded product pages and clarified pricing. The average dwell time increased, bounce rates fell, and customer service issues were cut in half.
Web Analytics & Behavioral Insights
Google Analytics and Search Console launched in early April, giving us clearer visibility into behavior. From April to June, we averaged 350–400 unique visitors/month, with 84% on mobile. Engagement was strong, especially on home page, vape, and solventless product pages.
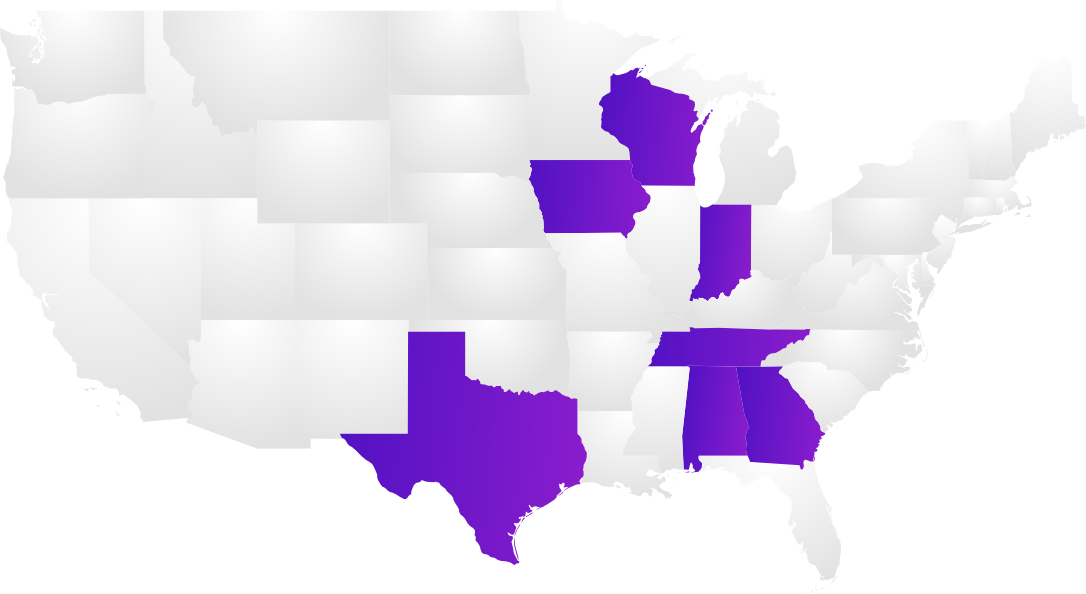
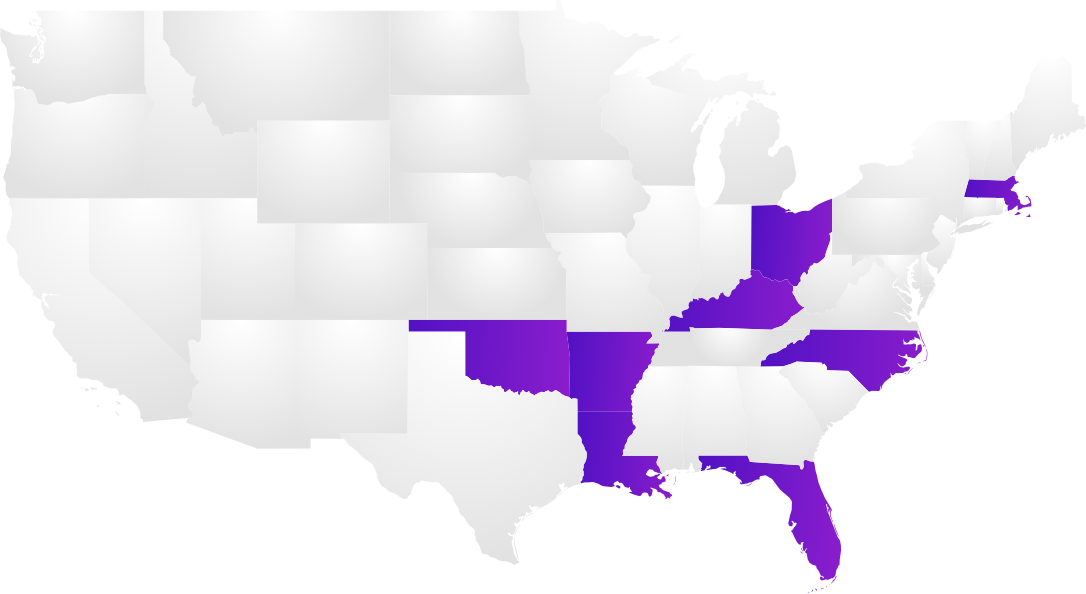
Metadata cleanup in May drove improvements in direct search results, product page rankings, and overall CTR. Organic traffic increased 54% between April and June. Branded search clicks rose 50%. Search Console confirms “Oil and Eve” is now a regionally discoverable name across Georgia and the Southeastern U.S.
Google Search & Brand Recognition
Search Console data validated our growth. “Oil and Eve” now appears in branded queries across Georgia and Alabama, and in long-tail product searches. We showed up in more than 2,800 branded impressions with a 5.4% CTR by the end of June. High-intent terms like “THCA flower delivery,” “rosin vapes Atlanta,” and “same day weed GA” are now our top-click terms.
Customer Behavior & Catalog Trends
Customers consistently favored solventless SKUs, in-house vapes, and fruit-forward edibles. White Runtz, GMO Papaya Rosin, and Starburst #26 performed best. Budget flowers and $1 prerolls served as upsell anchors for cart building — rarely ordered alone.
By June, 50%+ of order volume started from the homepage, not collection pages. Our AOV rose to ~$765 by the end of Q2. Items per order increased, with the biggest cart days following SMS restock alerts.
Key Performance Tables
Month-by-Month Sales Summary
| Month | Total Sales ($) | MoM Growth (%) | Orders | Items Sold |
|---|---|---|---|---|
| January | $0 | — | X | X |
| February | $X,100 | — | X | XX |
| March | $X,676 | +265.0% | XX | XX |
| April | $X3,239 | +72.5% | XX | XXX |
| May | $X,108 | -31.2% | XX | XXX |
| June | $X4,495 | +59.1% | XX | XXX |
Q1 vs Q2 Comparison
| Metric | Q1 (Feb–Mar) | Q2 (Apr–Jun) | % Change |
|---|---|---|---|
| Total Sales | $X,776 | $X6,842 | +276.9% |
| Orders | XX | XXX | +227.3% |
| Items Sold | XXX | XXX | +254.4% |
| Avg Order Value | ~$556 | ~$765 | +37.6% |
| Return Rate | N/A | 26% | ↑ Returners |
Closing Summary
In just six months, Oil & Eve has transformed from a concept into a trusted, fast-growing cannabis delivery brand with a clear voice and loyal customer base. Our early success was driven by smart sourcing, clean product formulation, mobile-first UX, and geo-targeted search strategy — all of which resonated with our Southeast audience. We built credibility through transparency, consistency, and an unwavering focus on solventless quality. With strong momentum from Q2 and a clear understanding of our customers' needs, we’re entering Q3 with sharpened tools, better data, and ambitious goals. The foundation is set — now we scale with intention.